
Fig. 5.
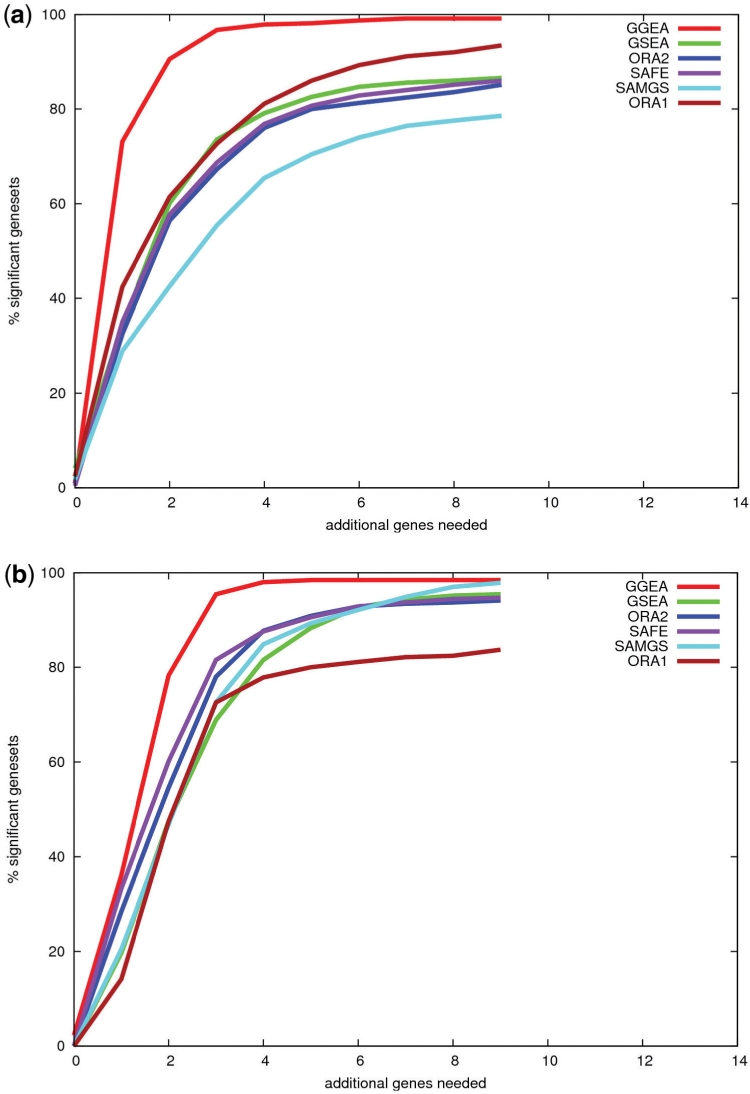
Explainability of expression changes in top ranked sets. The 700 top ranked gene sets (introduced in the consistency study above) of each method were restricted to genes with expression changes of statistical significance. For each restricted set, we computed the minimal number of genes not in the set, but needed to connect the significantly regulated genes of that set, to a regulation network. Displayed is the percentage of gene sets, for which x or less additional genes are needed. E.g. for GO sets (Fig. 5a), a single additional gene makes 73% of GGEA's top ranked sets explainable, while in case of ORA1 or SAMGS a single gene makes only 42 or 29% of the top ranked sets, corresponding to each method, explainable. The results are similar for KEGG sets (Fig. 5b).