
Figure 3.
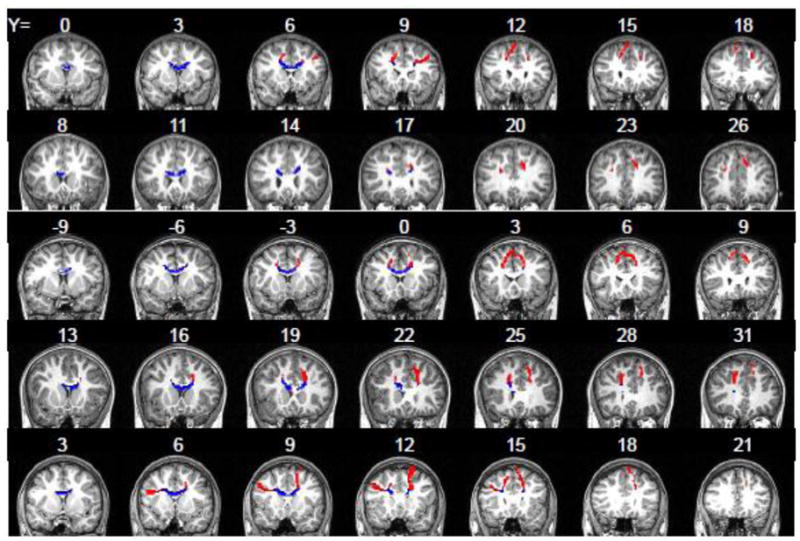
Interhemispheric tracts between lateral PFC clusters traced by the probabilistic tractography procedure in five representative subjects. The portion of the tract outside the corpus callosum is shown in red, while the portion within the corpus callosum (from which FA statistics were calculated) is in blue. Tracts are displayed on subjects’ anatomical images. Note the substantial variations in tract location, as demonstrated by the different Y coordinates at which the tracts emerged.