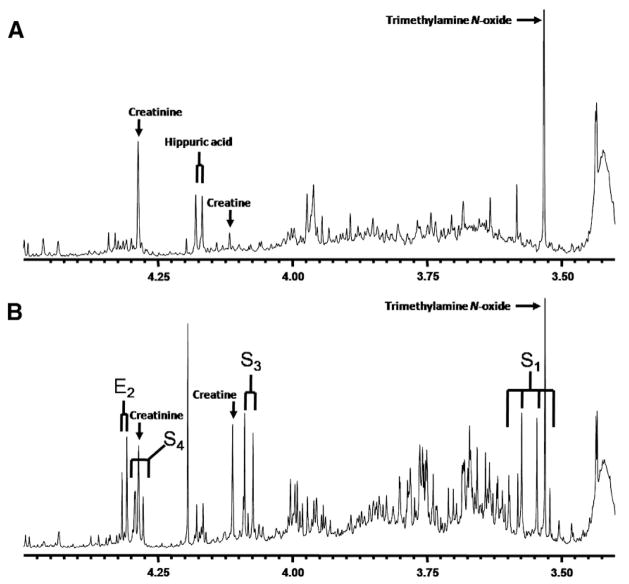
Fig. 4.
In vitro 1H-NMR spectra (500 MHz) of urine from mice measured at pH 2.50. (A) Urine of a control mouse. (B) Urine of a mouse with transaldolase deficiency (S=sedoheptulose and E=erythronic acid. Subscript numbers refer to the carbon position in the molecule [Table 2]).

