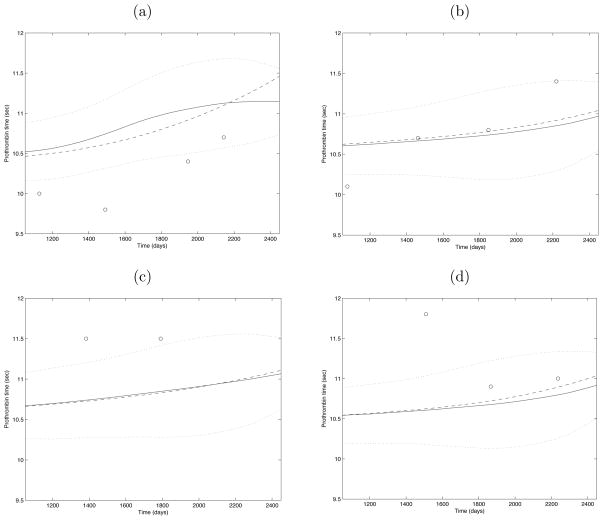
Figure 5.
Predicted trajectories for 4 randomly selected subjects. In each plot, circles denote the original response observations, the solid line is the response trajectory predicted via the proposed method, the dashed line is the predicted trajectory using the functional linear fit of Yao et al. (2005a), and the dotted lines represent the 95% asymptotic confidence bands.

