Figure 3.
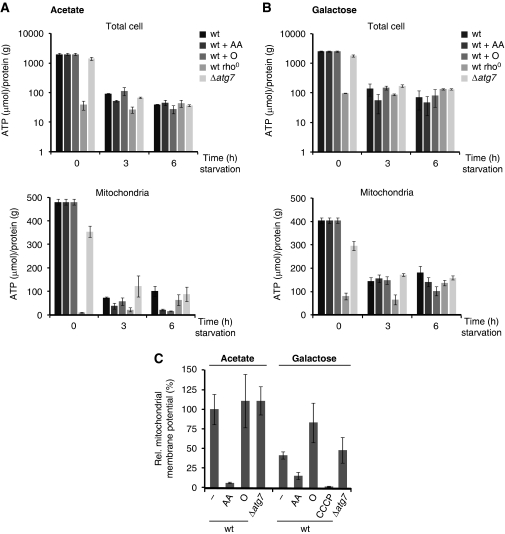
ATP level and mitochondrial membrane potential during amino-acid starvation. (A, B) Wild-type, rho0, and Δatg7 cells were exposed to amino-acid starvation medium supplemented with acetate (A) or galactose (B). When indicated, wild-type cells were exposed to antimycin A (AA) or oligomycin (O) during the amino-acid starvation period. ATP and protein from total cells (upper panels) or isolated mitochondria (lower panels) were determined at indicated time points. (C) Wild-type and Δatg7 cells were exposed to amino-acid starvation medium supplemented with acetate or galactose for 3 h. Wild-type cells were exposed to antimycin A (AA), oligomycin (O), or CCCP (50 μM) during the amino-acid starvation period when indicated. Cells were treated with the mitochondrial membrane potential-dependent dye DiOC6(3) and examined by fluorescence microscopy. Average pixel intensities for at least 10 mitochondrial tubules (n=10) in 5 representative cells were determined for each condition. Values for wild-type mitochondria in the presence of acetate were defined as 100% and relative values were calculated accordingly. The means and s.d. are shown.

