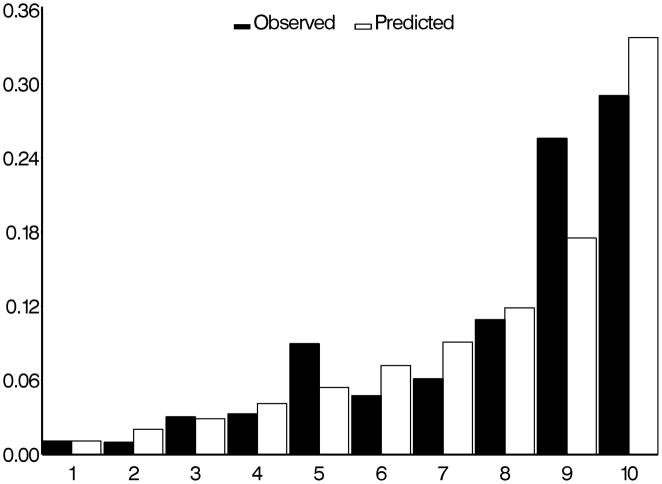
Figure 2.
Comparison of observed and predicted five-year incidence of POAG for the OHTS-EGPS pooled “asymmetry” model. The x-axis refers to the predicted probability of risk divided into 10 groups of approximately 90 participants each.
POAG=Primary open-angle glaucoma; OHTS=Ocular Hypertension Treatment Study; EGPS=European Glaucoma Prevention Study

