
Figure 3.
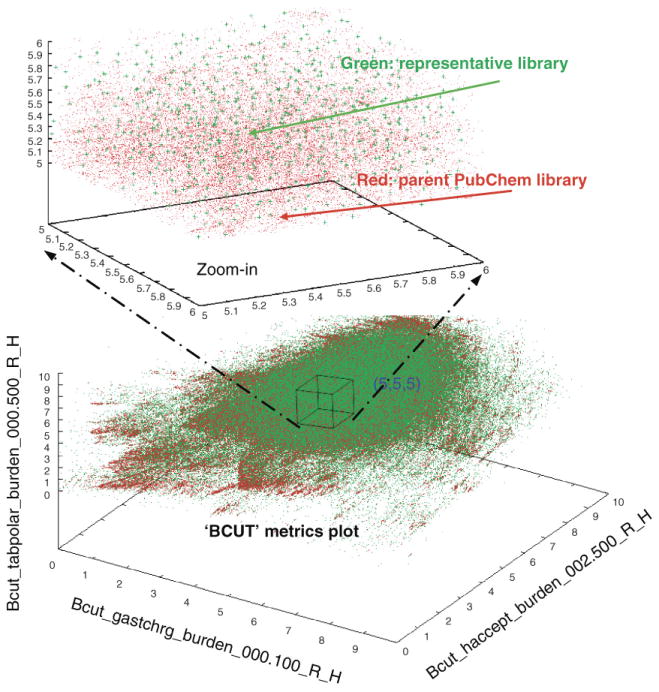
3D chemistry-space matrix plot of a representative sublibrary (green dots) created from the parent library PubChem database (red dots) by using the Diversity Analysis method based BCUT metrics calculation.
Official websites use .gov
A
.gov website belongs to an official
government organization in the United States.
Secure .gov websites use HTTPS
A lock (
) or https:// means you've safely
connected to the .gov website. Share sensitive
information only on official, secure websites.
3D chemistry-space matrix plot of a representative sublibrary (green dots) created from the parent library PubChem database (red dots) by using the Diversity Analysis method based BCUT metrics calculation.