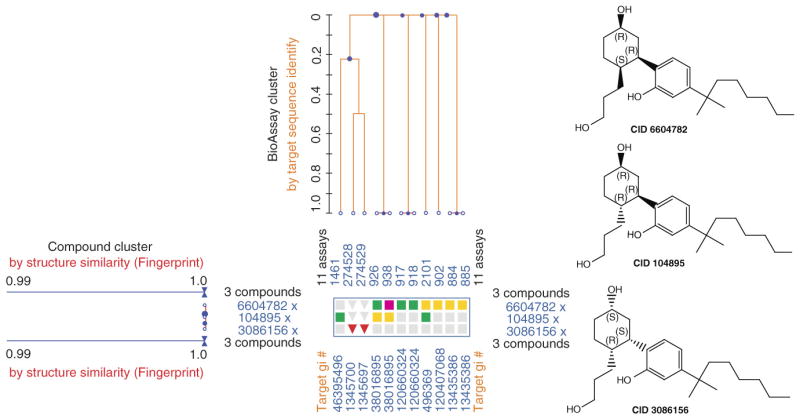
Figure 6.

A graph of PubChem Heatmap and BioAssay Cluster showing three isomers of the compound CP55940 and the correspondent biological test results across multiple targets that were measured from HTS experiments against a group of related protein targets. The three stereoisomers are represented as PubChem Compound identifier ‘CID’ and the structures at the right sides of heatmap. The three compounds were searched based on 2D structure similarity showing a similarity value of 1.0 (displayed at the left side of the heatmap), indicating they are identical structure but stereoisomers. Bioassay Clusters of the 11 assays (represented as PubChem BioAssay identifier ‘AID’) were derived based on the sequence similarity of the tested protein targets, where the GenBank identifiers of the corresponding protein targets (gi#) are listed at the bottom of the heatmap view. Each cell in the Heatmap represents an individual activity outcome of a small molecule for the corresponding target, with ‘active’ results denoted by red, yellow or green color, and ‘inactive’ results denoted by blue color.
