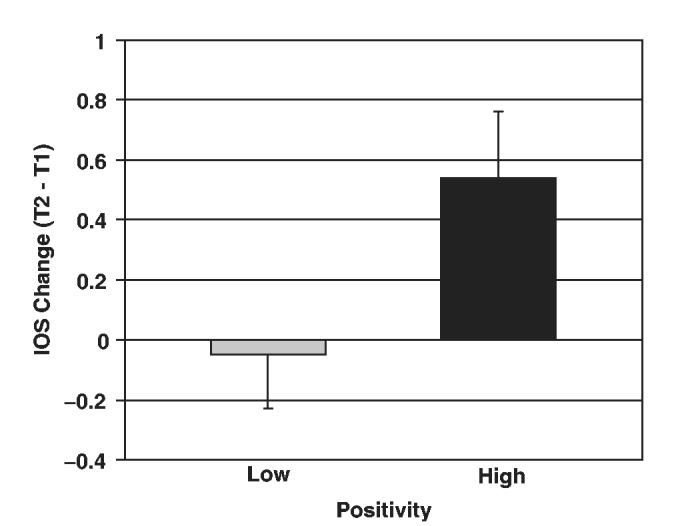
Figure 1.

Mean values for change in self–other overlap from Time 1 to Time 2 by positivity averaged across daily emotion reports. High positivity is ≥2.9 positive to negative emotion ratio; Low positivity is <2.9 positive to negative emotion ratio. Error bars are standard error of the mean.
