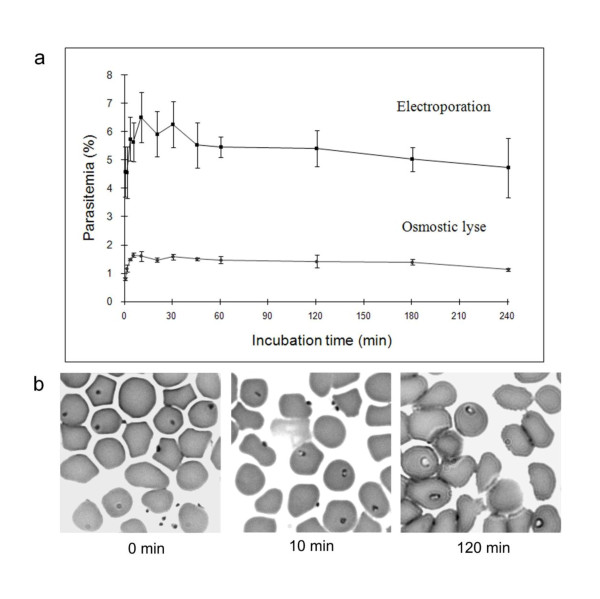
Figure 4.
a). Kinetics of erythrocyte invasion. Curves indicate the percentage of erythrocytes invaded with parasites prepared by high-voltage electroporation (squares) or by osmotic lysis (rounds) according to the time of incubation. Each figure represents the average value of parasitemia from the triplicate assays and error bars indicate the standard deviation. b). Photomicrographs of bovine erythrocytes following an invasion assay with merozoites prepared by electroporation. The photos were taken immediately after contact and at 10 min and 120 min.

