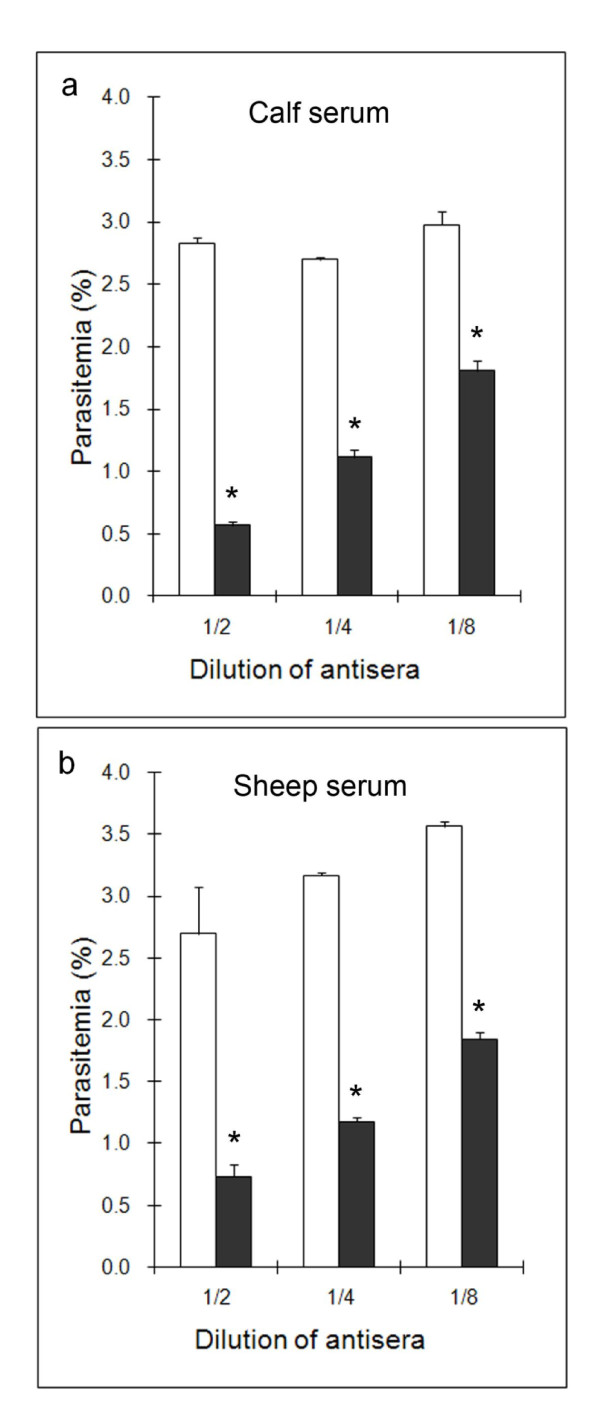
Figure 7.
Inhibition of invasion by sera directed against B. divergens. Invasion was performed with antisera of calf C139 and sheep S-M-SC (black bars) and compared to the negative sera of calf and sheep (white bars). Each figure represents the average value of the triplicate assays and error bars indicate the standard deviation. Significant differences (P < 0.05) between antisera and negative sera are indicated with stars.

