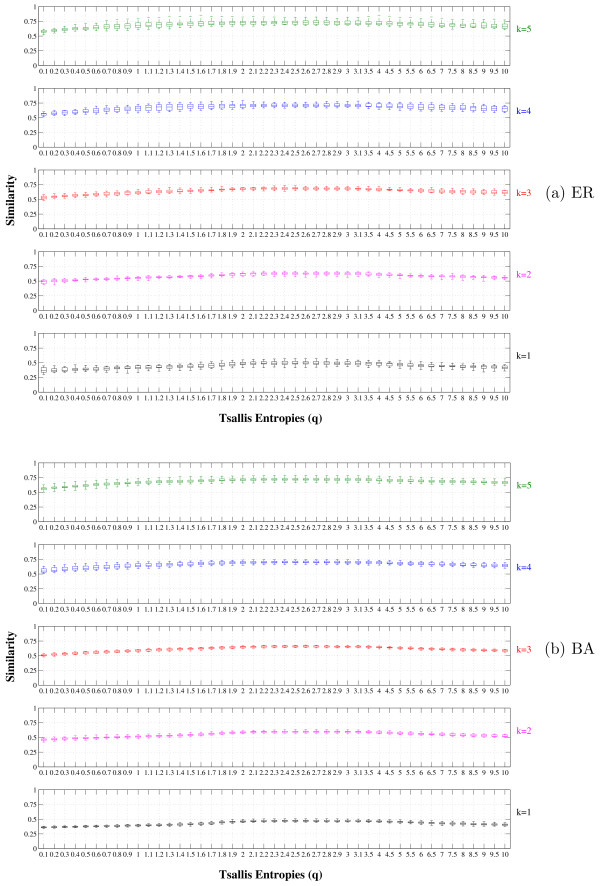
Figure 2.
Distribution of the similarity values between AGNs and inferred networks as a function of the entropic parameter q. Distribution of the similarity values between source and inferred networks as a function of the entropic parameter q for each average connectivity (1 ≤ 〈k〉 ≤ 5): (a) boxplot for the uniformly-random Erdös-Rényi (ER) and (b) boxplot for the scale-free Barabási-Albert (BA). The simulations were performed for 100 genes (N = 100) and represent the average over 50 runs.

