
Figure 2.
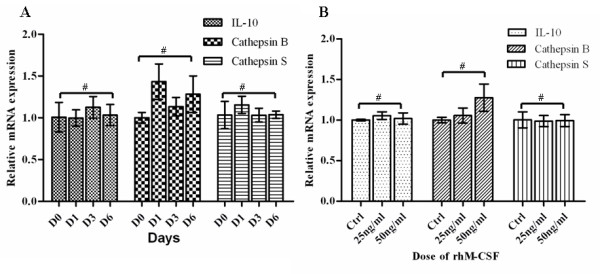
The mRNA expression levels of IL-10, cathepsin B and cathepsin S in normal macrophages. Results are given as fold increase in mRNA expression with respect to expression in D0 monocytes. Data were normalized to expression of the β-actin gene. A: Monocytes(D0) was used as a calibrator. B, monocytes culture without rhM-CSF was used as a calibrator (Ctrl). Error bar is SD, Independent experiments were repeated three times, all #p > 0.05(by student t-test).