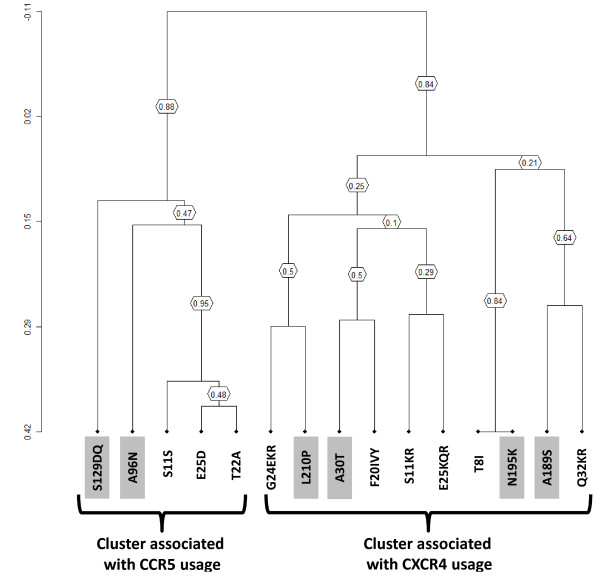
Figure 2.
Clusters of correlated mutations. Dendrogram obtained from average linkage hierarchical agglomerative clustering, showing significant clusters involving V3 and gp41 (gray box) mutations. The length of branches reflects distances between mutations in the original distance matrix. Boostrap values, indicating the significance of clusters, are reported in the boxes. The analysis was performed in sequences derived from 196 patients, 91 reported as R5-tropic and 105 reported as X4-tropic at genotypic test.

