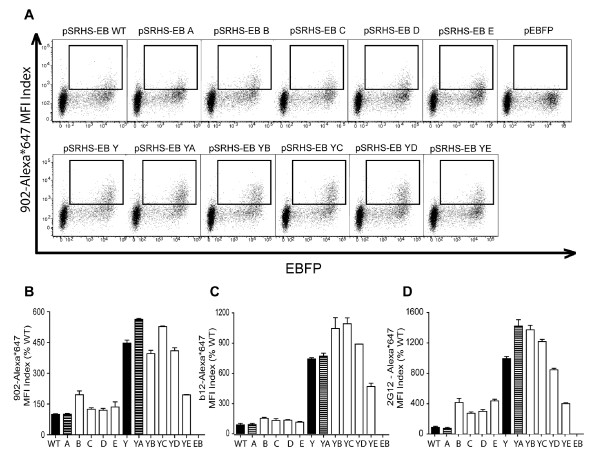
Figure 4.
Cell surface expression of envelope glycoproteins. (A) COS-1 cells transiently transfected with each of the pSRHS-EB Env expression vectors were immunostained with Alexa*647-conjugated anti-gp120 mAb 902. The dot plot panels are separated into two series for analysis: (1) those containing the WT Y712 motif in the top row, and (2) those containing the Y712C motif in the bottom row. (B) The quantified surface expression levels of the Env glycoproteins are shown as the relative mean fluorescence intensity (MFI) Index (MFI x% of cells double positive for EBFP and Alexa*647). Additional cells were stained with Alexa*647-conjugated anti-gp120 mAb b12 (C) and anti-gp120 mAb 2G12 + Alexa*647-Goat anti-hu IgG (H+L) (D). The error bars represent the standard deviation of the means.

