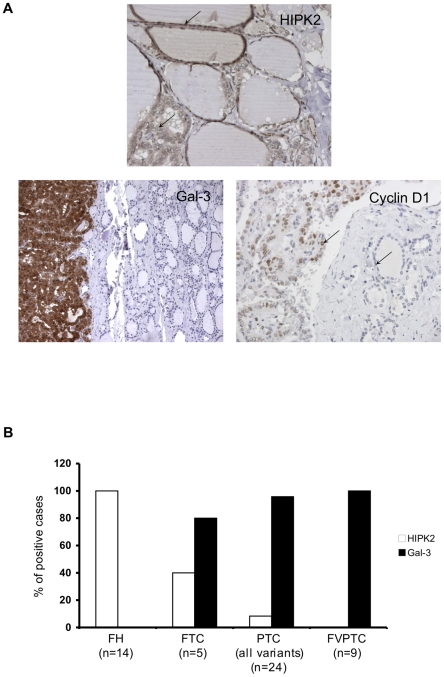
Figure 1. Inverse correlation between HIPK2 and Gal-3 expression in WDTCs.
(A) Representative immunohistochemical analysis of HIPK2, Gal-3 and Cyclin D1 in PTC. Arrows indicate positive immunostaining for HIPK2 (upper panel) and Cyclin D1 (lower, right panel) into the nuclear compartment of respectively normal and papillary thyroid cells. In the lower left panel is clearly visible cytoplasmic expression of Gal-3 in tumoural tissue. (B) The histogram shows, for each histotype, the percentage of positive cases at the immunohistochemical expression analysis for HIPK2 (white bars) and Gal-3 (black bars).

