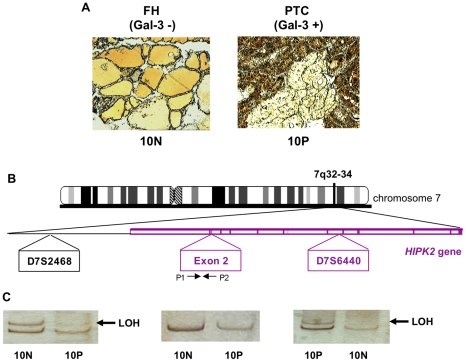
Figure 3. LOH analysis of HIPK2 gene locus 7q32-34 in WDTCs.
(A) Histological pictures of PTC and its matching extra-tumour thyroid tissue immunostained for Gal-3. The upper right panel shows the histological area subjected to laser-based microdissection. (B) Schematic representation of chromosome 7, HIPK2 locus, and regions including the two microsatellite markers and one HIPK2 exon amplified by PCR in cells dissected as in (A). The microsatellite amplification products (left and right panels) were resolved onto 12% PAGE and visualized by silver staining. The arrows indicate the missing bands diagnostic of LOH. Quantitative PCR products amplified with the indicated exon 2 primers were resolved and stained as above (central panel).

