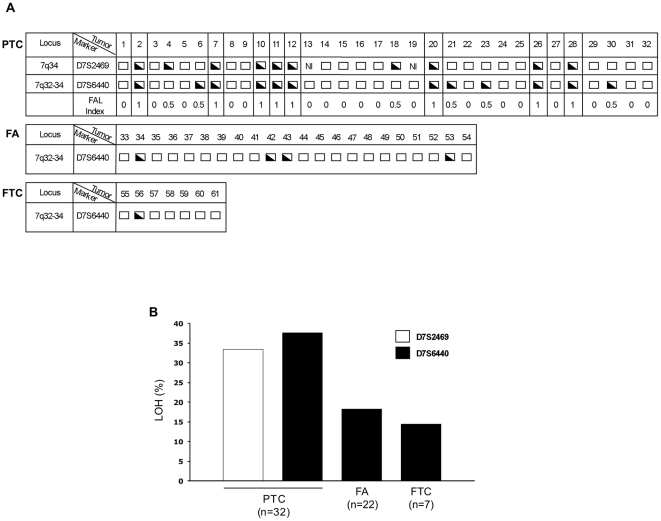
Figure 4. Analysis of allelic loss affecting HIPK2 gene in WDTCs.
(A) Results of LOH analysis at the indicated loci and microsatellite markers in 32 PTCs, 22 FAs and 7 FTCs of group C patients. For each case the retention of heterozigosity (empty box), the LOH (half-filled box), the non-informative condition (NI) as well as the FAL index are reported. PTC cases showing LOH at both microsatellites are highlighted in boxes. (B) The histogram shows the percentage of LOH in each indicated histotype, evaluated at the two microsatellites, namely D7S2469 (white bar) and D7S6440 (black bars).

