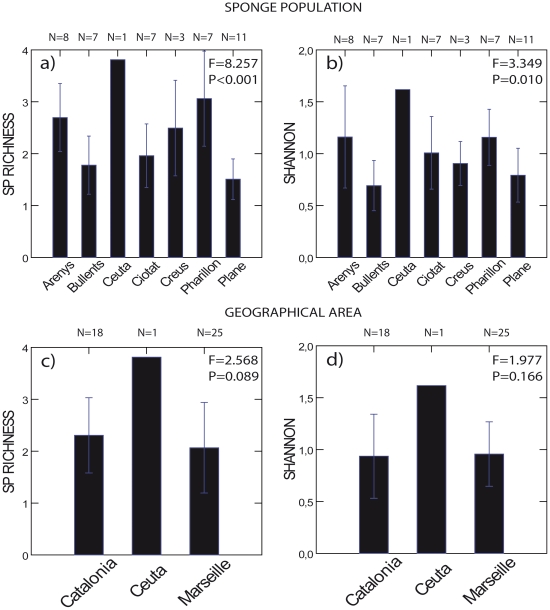
Figure 3. Chemical diversity of Spongia lamella.
Chemical diversity was estimated in Spongia lamella at the population level a) and b), and at regional level c) and d) for peak richness and Shannon indices, respectively. Vertical bar is 1 standard deviation. Note lack of variation in Ceuta. A single specimen from this location was observed, sampled, and used in the analyses. One-way ANOVA: df = 6 at the population level, df = 2 at the regional level; F and P values included. See Table 1 for Post hoc Fisher's LSD tests.

