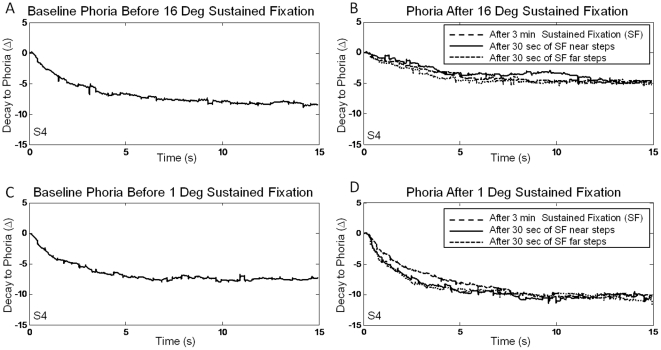
Figure 3. Right eye movement responses decaying to the phoria position during the baseline recording (left plots A and C).
Adapted phoria responses are plotted on the right plots (plot B and D). Right eye movement responses decaying to the phoria position after 3 minutes of sustained fixation (long dashed line), after 30 seconds of sustained fixation during the near step phase (solid line) and after 30 seconds of sustained fixation during the far step phase (short dashed line) are shown in the right plots. The right eye movement response decaying to phoria is shown under two sustained fixation conditions, 16° or near adaptation (Plot B) and 1° or far adaptation (Plot D).

