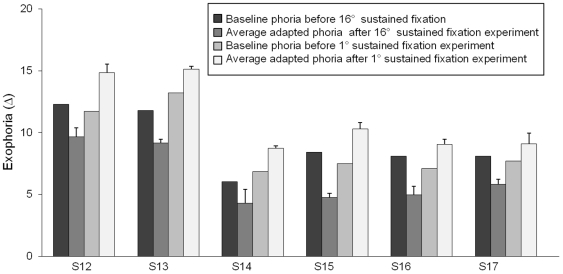
Figure 4. Summary per subject of baseline phoria before 16° sustained fixation (dark gray bar), baseline phoria before 1° sustained fixation experiment (light gray bar), adapted phoria after 16° sustained fixation task (medium gray bar) and adapted phoria after 1° sustained fixation task (white bar) for all six subjects.
Adapted phoria measurements are the average of phoria measurements after the three minutes of sustained convergence, after near steps with an initial vergence position of 12° and after far steps with an initial vergence position of 1°. The error bars are one standard deviation from the mean.

