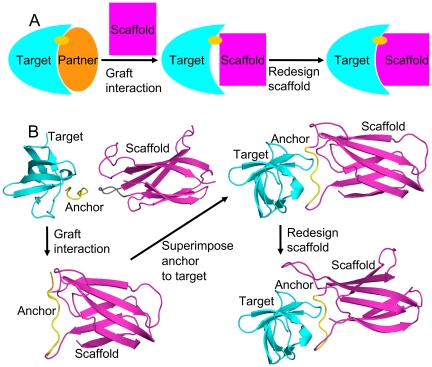
Figure 1. Anchor insertion.
Panel A demonstrates the AnchoredDesign process with a simple cartoon. At left, we start with a known interaction between a target (cyan) and a natural partner (orange) with a characteristic interaction (the anchor, yellow). In the middle, we graft the anchor into the scaffold (magenta) to create a rough starting structure. At right, we fill out the scaffold-target interface with the AnchoredDesign protocol. Panel B demonstrates the process using protein structures for greater clarity (using the same color scheme).

