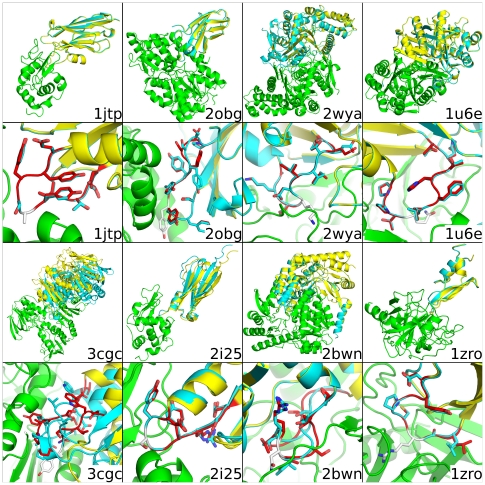
Figure 5. Best scoring prediction for 8 complexes.
This figure demonstrates the relaxed crystal structure input and AnchoredDesign's lowest-score prediction for 8 of the 16 structures. The first and third rows show whole structures, and the second and fourth zoom in on the predicted loops. The nonmoving side of the interface is in green, the actual partner in cyan and the prediction in yellow. The predicted loop is red and the anchor is white. Structures are labeled with their PDB code in the lower right of each cell. For most structures, the predicted rigid-body placement and loop is indistinguishable from the relaxed crystal structure; 3cgc (lower left) is the exception. The other 8 structures are shown similarly in Figure S2.

