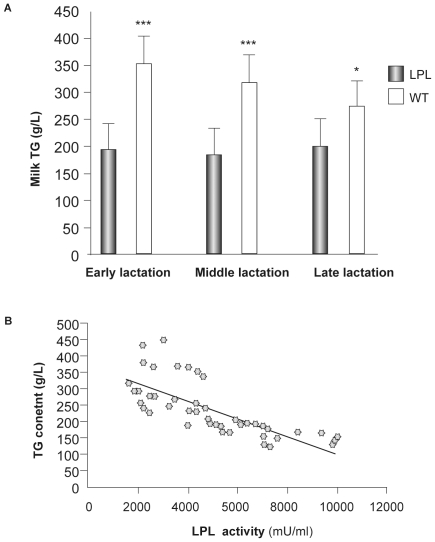
Figure 2. Change of TG concentration in transgenic milk.
(A) TG content in milk of transgenic and WT mice during different lactation stages. Ten transgenic mice and six WT mice were tested. Bars represent mean (SD). (* P<0.05, *** P<0.001) (B) Correlation of TG concentration and LPL activity in milk of transgenic and WT mice during different lactation stages. (rho = 0.725 P<0.0001) [Data tested using Spearman's Rank test].

