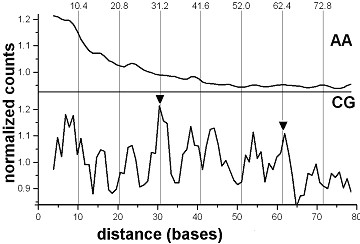
Figure 1.

AA and CG dinucleotides in the human genome. Positional autocorrelation of AA and CG dinucleotides in the complete human genome. The normalized histograms of occurrences of the dinucleotide pairs at distances 2-80 bases from one another are shown. The histograms are smoothed by running average of 3 positions. Level 1.0 corresponds to average scores of the respective raw histograms (3.29 × 10⁷ for AA and 6.38 × 10⁵ for CG). Two peaks on the CG curve (arrowheads, at positions 31 and 62) correspond to 10.4 × 3 base distances between CG dinucleotides in Alu sequences (see text). Vertical grid lines indicate the 10.4 base nucleosome DNA period.
