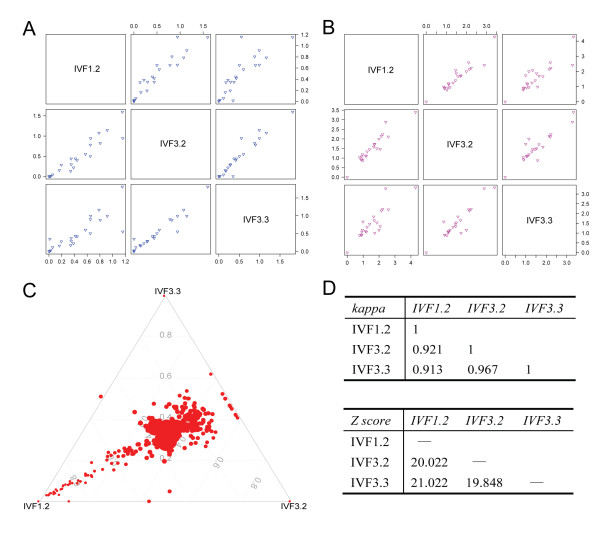
Figure 3.
Consistency of miRNA expression among three rESC lines. Pairwise comparisons of miRNA clusters between IVF1.2, IVF3.2 and IVF3.3 were performed. Each triangle dot represents an individual pairwise comparison of a miRNA cluster based on variability (A) and CV statistics (B); (C): Trio-comparison of distinct miRNA expression between IVF1.2, IVF3.2 and IVF3.3 based on the differential index. Each point indicates the normalized count of each miRNA; (D): Association analysis of total miRNA expression between IVF1.2, IVF3.2 and IVF3.3 using Kappa statistical analysis and Z-score.

