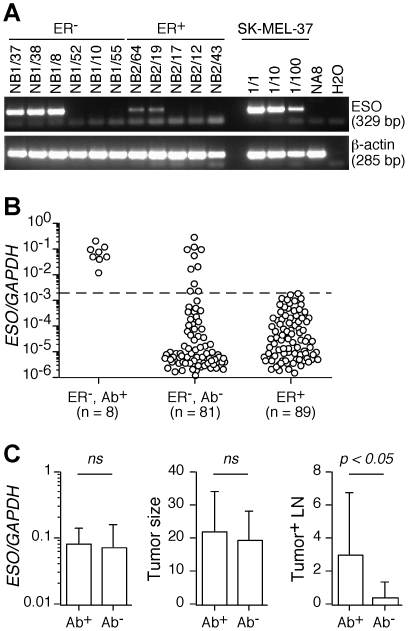
Figure 3. Assessment of ESO expression in ER− and ER+ BC tumors.
A and B. ESO expression in cryopreserved ER− and ER+ BC tumors was assessed by semi-quantitative PCR (A) and qPCR (B). C. The level of ESO expression in the tumor as assessed by qPCR (left panel, mean ± SD), the size of the primary tumor at diagnosis (middle panel, mean ± SD) and the number of tumor-invaded lymph nodes (right panel, mean ± SD) are shown for ESO Ab+ (n = 8) and ESO Ab− (n = 10) patients with ESO-expressing tumors. Statistical analyses were performed using a two-tailed t-test.

