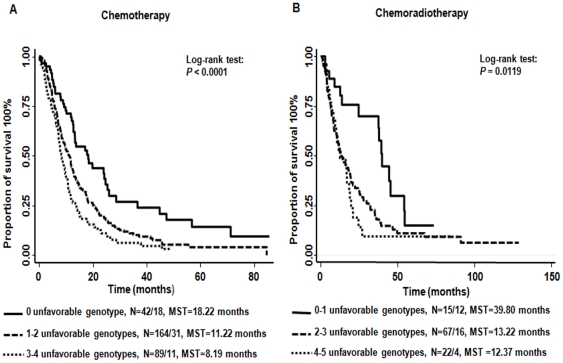
Figure 1. Kaplan-Meier estimates of the cumulative effect of unfavorable genotypes on NSCLC survival stratified by treatment.
Solid line represents low-risk group, carrying 0 unfavorable genotypes in chemotherapy (A) and 0-1 unfavorable genotypes in chemoradiotherapy (B). Dashed line represents the medium-risk group, carrying 1-2 unfavorable genotypes in chemotherapy (A) and 2-3 unfavorable genotypes in chemoradiotherapy (B). Dotted line represents high risk group, carrying 3-4 unfavorable genotypes in chemotherapy (A) and 4–5 unfavorable genotypes in chemoradiotherapy (B). N: Number of Dead/Alive. MST: median survival time.

