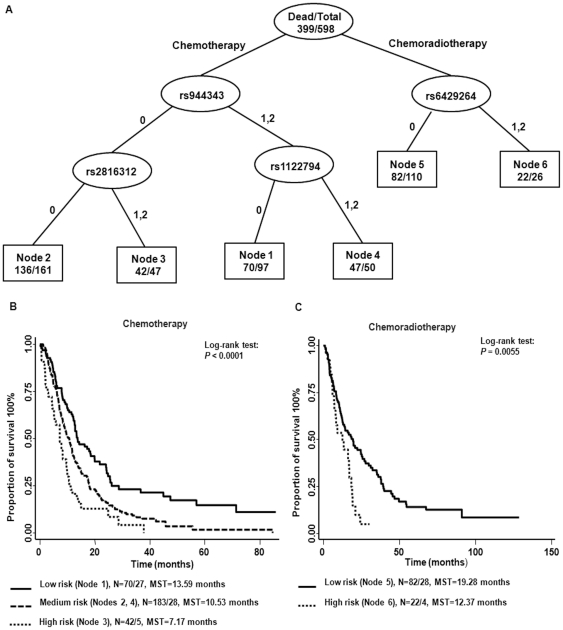
Figure 2. Survival tree analyses and Kaplan-Meier estimates of the significant RGS SNPs associated with survival.
(A) Survival tree analyses; 0:homozygous wild type genotype; 1:heterozygous genotype; 2:homozygous variant genotype. (B) and (C) represent the survival curves of the risk group in chemotherapy group and chemoradiotherapy group; N: Number of Dead/Alive. MST: median survival time.

