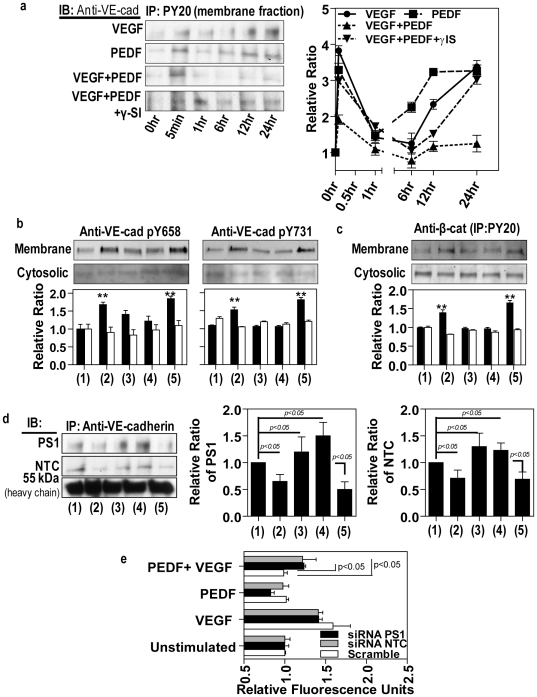
Figure 7. PEDF inhibits VEGF-induced phosphorylation of membrane-bound AJ proteins and promotes association of presenilin and nicastrin with VE-cadherin.
Confluent retinal endothelial cells were either unstimulated (1) treated with VEGF alone (2), PEDF alone (3), VEGF followed by PEDF 6 hours later without (4) and with (5) γ-secretase inhibitor over 24 hours. VEGFA and PEDF were used at 100 ng/ml and γ-secretase inhibitor at 1 nM. Cells were separated into membrane and cytosolic fractions followed by immunoprecipitation. (a) Total VE-cadherin levels were determined by immunoprecipitation of the membrane fraction with anti-PY20 and Western blots for VE-cadherin. A panel of representative Western blots is shown on left and band intensities of replicate experiments (n = 4) on the right. (b) Western blot analysis to assess the effect of the different treatments on tyrosine phosphorylation of VE-cadherin at sites Y658 and Y731 (n = 4 independent experiments). (c) Total phosphorylation of β-catenin was assessed by immunoprecipitation of the membrane fraction with anti-PY20 and Western blots for β-catenin. (n = 4) (d) The association of presenilin-1 (PS1) and nicastrin (NTC) were confirmed by immunoprecipitation with anti-VE-cadherin, followed by Western blot analysis using anti-presenilin-1 and nicastrin. (e) To further confirm a role for γ-secretase in regulating vascular permeability presenilin-1 or nicastrin were knocked down with by transfection with AAV 2 expressing PS1 and NTC siRNAs. Scrambled siRNA acted as a control. Paracellular macromolecular permeability to 40 kDa Dextran-FITC was determined in cells treated with VEGF, PEDF, VEGF+PEDF and compared to unstimulated control. Densitometry analyses in (a), (c) and (d) are shown as the relative ratio of phosphorylated pVE-cadherin, pβ-catenin, presenilin-1 and nicastrin to heavy IgG chains. Densitometry in b is shown as the relative ratio to α-tubulin. The data are mean ± SEM. *p<0.05, **p<0.01 versus unstimulated group.

