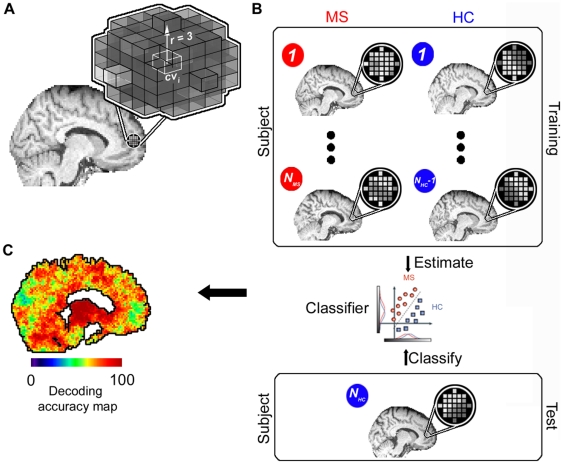
Figure 2. Mapping of brain regions with diagnostic information.
(A) ‘Searchlight’ approach that searches across the brain for local tissue intensity patterns that are informative about the clinical condition (MS, healthy control [HC]). For a given ‘center’ voxel cvi in the brain the searchlight is defined as a spherical cluster with a radius of three voxels surrounding the center coordinate. Thus, a searchlight contained 123 spherically arranged voxels if the minimal distance to the boundary of the search space was at least three voxels. However, when the center voxel was located closer to a boundary of the search space of a given analysis the searchlight could deviate from the spherical shape and contain less voxels in order to guarantee that only voxels belonging to the supposed tissue class were contained in searchlights in a given analysis. (B) Within this cluster of voxels the spatial pattern of intensities is extracted for each subject separately. The data from all (Ntotal = NMS + NHC) but one subject (Ntotal1) are used as a ‘training dataset’ to train a classifier to distinguish between patterns from the two groups. The classifier is then tested by applying it to the data from the remaining ‘test’ subject (in this example NHC). This leaveoneout (LOO) crossvalidation procedure was then repeated ntimes by leaving out the data of one subject at a time from the training data set. The success of the classifier is an estimate of the local information at that position in the brain. (C) The resulting accuracy was then noted at the coordinate cvi as the local information related to the clinical condition. By iterating this procedure across different positions in the brain it is possible to obtain a map of diagnostic accuracies for each coordinate cvi, depicting the diagnostic information contained in local patterns in decoding the clinical condition.

