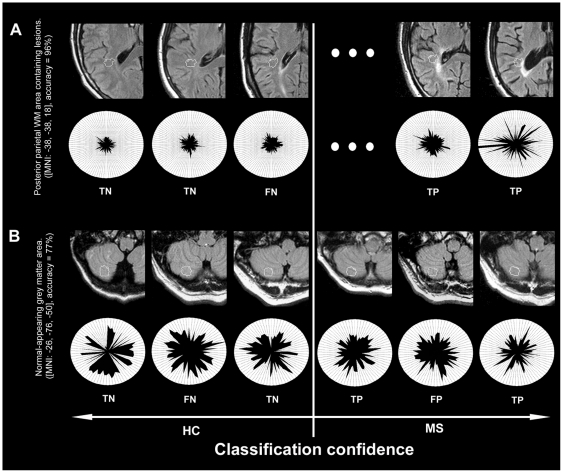
Figure 3. Image features with information on the clinical status.
In order to provide insights into pathology indicating MR image features we depict exemplary searchlight classifiers in the native space of individual subjects, i.e. their native TIRM images (0.5×0.5×3 mm voxel resolution) and highlight the pattern structure of selected subjects. (A) Posterior parietal white matter searchlight that obtained maximal accuracy in the lesion area analysis for uncorrected data (96%, p<1013). Top row: Outer contour lines correspond to the border of searchlights. Inner contour lines correspond to the voxel in the respective searchlight that was most important for the multivariate decision process. The sorting of individual images from left to right follows the diagnoses of the classifiers (left: images that were diagnosed as controls, right; images that were diagnosed as patients; eccentricity follows diagnostic confidence). Bottom row: Polar plot of the tissue intensity patterns drawn from the voxels located in this area in the normalized TIRM images of individual subjects (2×2×2 mm voxel resolution), sorted clockwise by the relevance of a voxel for the classification in descending order. The plot suggests that the classifier grounds its decisions mainly on a set of hyperintense voxels in patients that are distributed across the searchlight. (B) Searchlight of maximal accuracy in the NAGM area analysis based on data corrected for deformation effects. The TIRM image characteristics and the polar plot depicted underline the capability of the pattern recognition approach to identify disease indicating information from brain tissue characteristics ‘invisible’ to the human eye. TP, true positive; TN, true negative; FP, false positive; FN, false negative.

