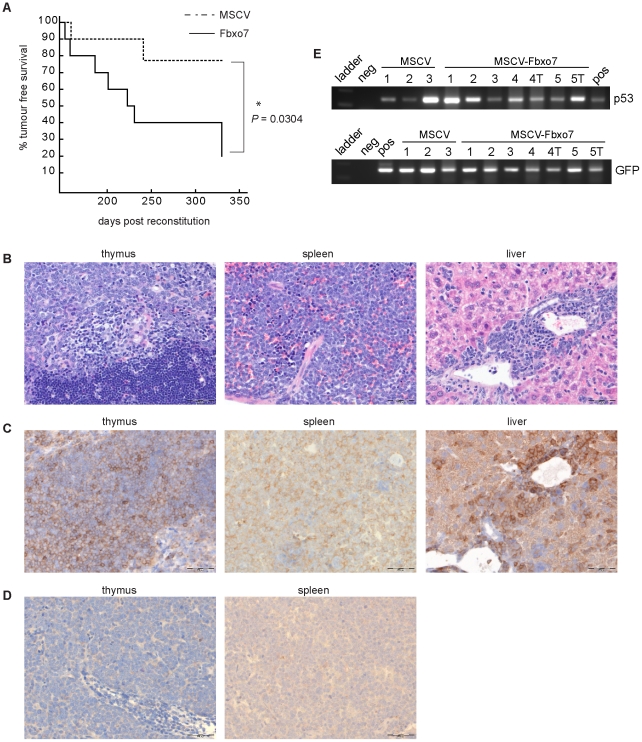
Figure 5. Fbxo7 cooperates with p53 mutation to promote lymphomagenesis in vivo.
(A) Graph of Kaplan-Meier survival curve of mice reconstituted with p53 null FL cells infected with retroviruses expressing either MSCV control (n = 10, dashed line) or Fbxo7 (n = 10, solid line). (B) H&E staining and immunohistochemistry was conducted as previously described [11] for (C) CD3 and (D) Fbxo7 in tissue samples from mice reconstituted with Fbxo7-expressing cells. Size bar is 50 µm. (E) PCR amplification reactions for either the p53 null allele (top) or the GFP gene in the MSCV vector (bottom) performed on genomic DNA isolated from paraffin-embedded tissue samples from mice reconstituted with p53 null HSPCs infected with retroviruses bearing either the empty MSCV vector or the MSCV vector expressing Fbxo7. Numbered samples consist of pooled biopsies from multiple organs (liver, spleen, thymus, intestine, kidney, heart) from mice in the two different cohorts, as indicated. ‘T’ denotes samples which consisted of tumour tissue only. For positive controls for the PCR reactions, in the p53 reaction (top), ‘pos’ denotes a reaction where genomic DNA from a p53 null mouse was added, and for the GFP reaction (bottom) ‘pos’ denotes a reaction where MSCV plasmid DNA was added. ‘Neg’ denotes reactions where no template DNA was added.

