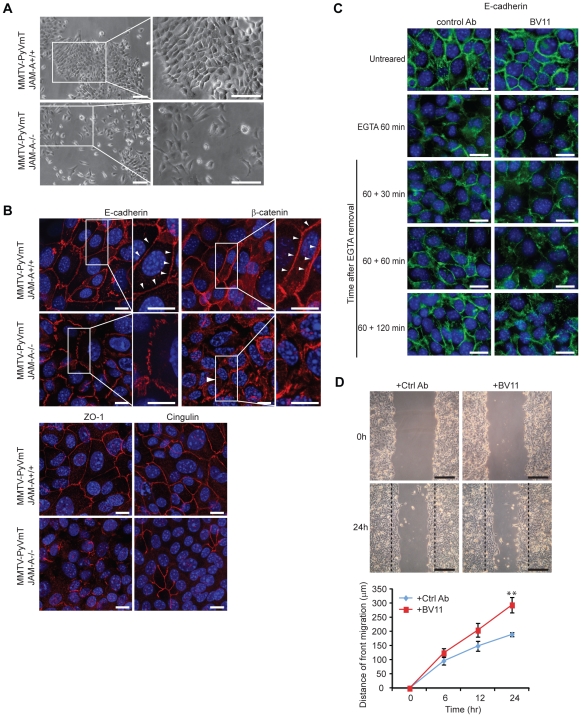
Figure 3. Inhibition of JAM-A expression and function affects mammary tumor cell morphology and organization of cell-cell junctions.
A) Phase-contrast microscopy of cultured mammary tumor cells derived from MMTV-PyVmT/JAM-A+/+ and JAM-A−/− tumors. JAM-A+/+ cells formed confluent islands with epithelioid morphology and tight intercellular junctions. In contrast, JAM-A−/− cells form loosely organized islands and frequently grow as single cells with spindle shape morphology. Scale bar; 200 µm; B) Immunofluorescence staining of markers of adherens junctions (E-cadherin, β-catenin) and tight junctions (ZO-1, cingulin). While JAM-A+/+ tumor cells present a continuous junctional staining of E-cadherin, β-catenin, ZO-1 and cingulin at intercellular contacts, in JAM-A−/− cells the distribution of these markers was reduced or discontinuous (arrowhead). Scale bar; 15 µm; C) The effect of BV11 JAM-A blocking Ab on Ca2+ switch assay. 4T1 cells were incubated with EGTA for 60 min to disrupt E-cadherin junctional localization and Ca2+ was then added back to the cells to restore E-cadherin staining. In the presence of a JAM-A blocking Ab BV11 E-cadherin staining was partially inhibited and still largely incomplete up to 120 min. Scale bar; 20 µm; D) 4T1cell migration was significantly increased by a JAM-A blocking Ab (BV11). Upper panels report phase contrast microscopy of a typical experiment. Scale bar; 500 µm. Lower panels show a quantification of the distance of migration of the front. Values are means ± SEM of 4 replicates from a typical experiment out of 3 performed. **p<0.01 by unpaired Student-t test.

