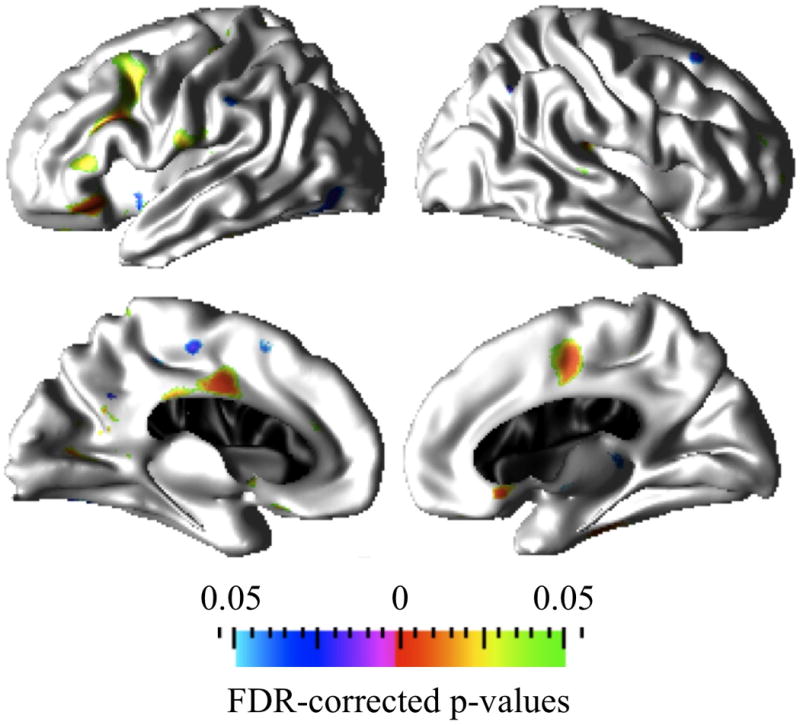
Figure 4.

Prominent cortical clusters where Average+ IQ controls and Average+ IQ CPS groups differ significantly (FDR corrected at q=0.05) in the association between age and cortical thickness. Red to green hot colors indicate increased cortical thickness (or lack of thinning) with age whereas purple to blue cold colors indicate greater thinning with age in the Average+ IQ CPS group compared to the Average+ IQ control group.
