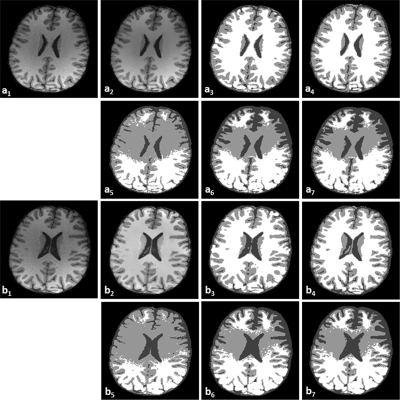
Figure 10.
Classification of real brain MR images. a1 and b1 are the original MR images. a2 and b2 are the images after bilateral filtering. a3 and b3 are the classified results of the MsbFCM method. a4 and b4 are the manual segmentation results. a5 and b5, a6 and b6, and a7 and b7 are the classification results using the FCM, MFCM, and MsFCM methods, respectively.

