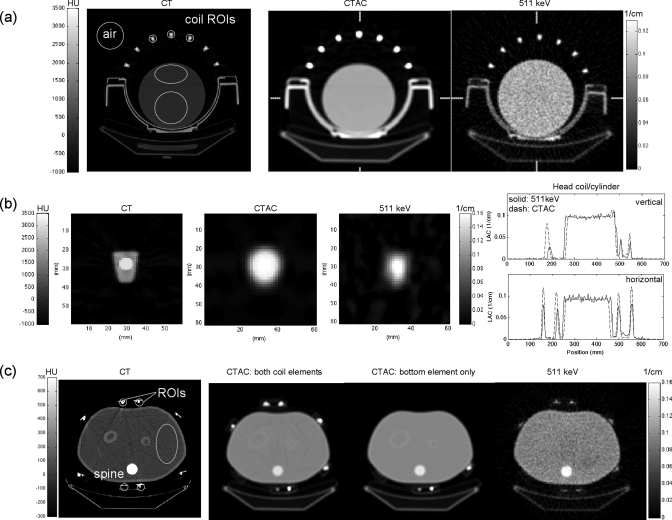
Figure 4.
(a) Cylinder phantom and head-coil. Left: high-resolution CT image (120 kVp, 168 mAs); Center: CTAC (140 kVp, 190 mAs); Right: 511 keV transmission image (68Ge). Right-hand color bar applies to center and right images. (b) Details of images in (a): close view of one of the upper head-coil elements; left-to-right corresponding to images above. Right: Profiles of the CTAC and 511 keV transmission images [LAC = linear attenuation coefficient. Horizontal and vertical profiles through the center of the images as indicated by edge hash marks on images in (a)]. (c) Torso phantom and coil, from left-to-right: high-resolution CT, CTAC with both coil elements, CTAC with bottom element only, 511 keV transmission. Right-hand color bar applies to three rightmost images. The 511 keV transmission images contained 480M and 700M corrected counts in the cylinder image and torso image, respectively.

