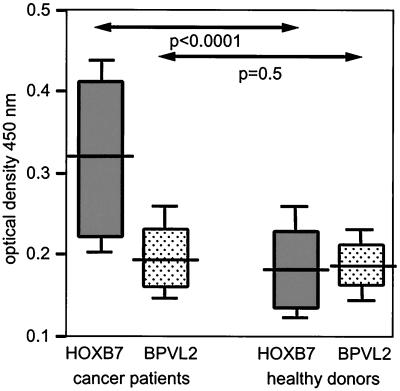
Figure 2.
Serologic responses to HOXB7 as assessed by ELISA. BPVL2 protein was used as a negative control protein. Sera were diluted 1:500. Shown are values of statistical significance for differences in optical density at 450 nm of sera of patients (n = 39) and of healthy women (n = 29) as determined by the Mann–Whitney u test. Statistical significance for differences in responses to HOXB7 and to BPVL2 were assessed by the Wilcoxon's signed-rank test for paired data and were found to be P < 0.0001 for patients and P = 0.4 for healthy women. Horizontal bars indicate median values

