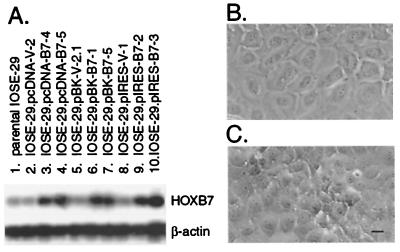
Figure 4.
HOXB7 expression levels and morphology of transfected IOSE-29 cells. (A) RT-PCR analysis detected HOXB7 expression levels in HOXB7-transfected cells (lanes 3, 4, 6, 7, 9, 10) that were markedly higher than in cells transfected with vector DNA alone (lanes 2, 5, 8) and in the parental cell line (lane 1). Phase-contrast microscopy revealed that IOSE-29 cells transfected with vector DNA grew in flat monolayers (B), whereas cultures of HOXB7-transfected cells exhibited islands of multilayered overgrowth (C). (Bar = 10 μm.)

