
Figure 1. Increased Dio3 (A), and decreased TRα1 (B) and GR (C) protein levels in alcohol-exposed (E) placentae on G21.
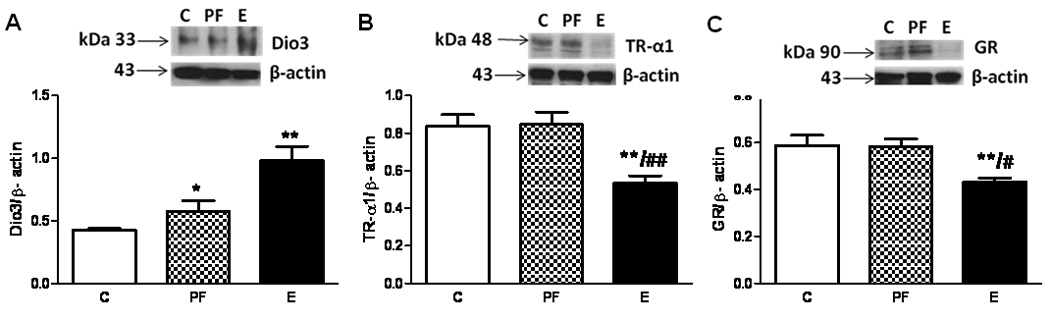
Insert shows representative Western blots for specific proteins and β-actin. Placental protein levels were normalized to β-actin. Values are shown as means +/− SEM, *p<0.05 or **p<0.01 compared to control (C) placenta; #p<0.05 or ## p<0.01 compared to PF placenta.