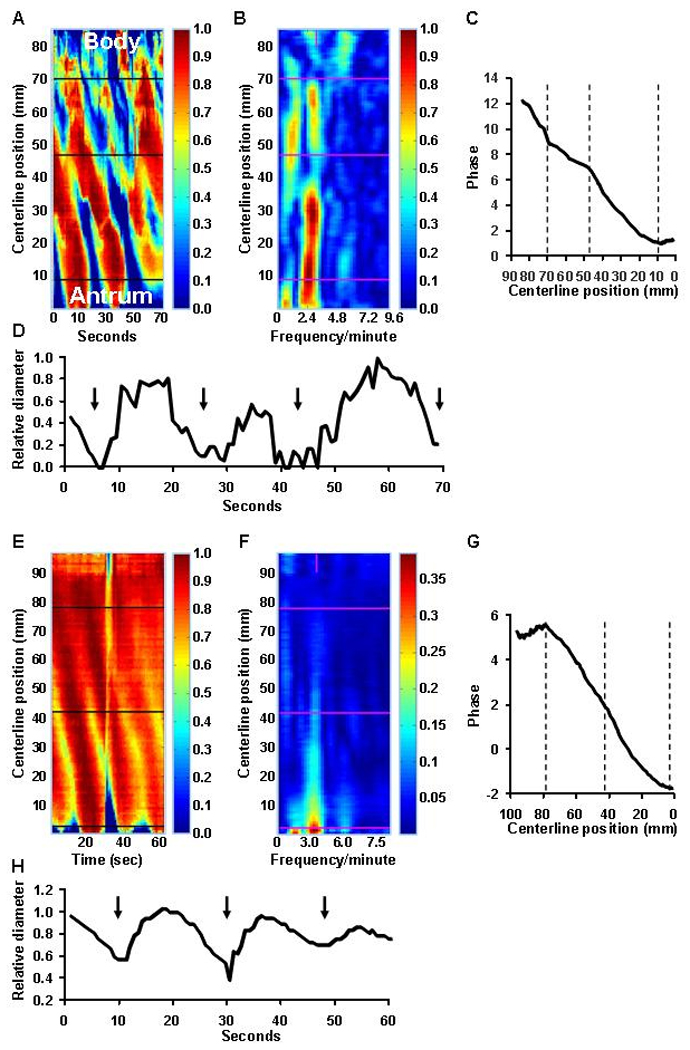
Figure 2.

Analysis of gastric contractions (“contractograms”) from the same study shown in Figure 1. Panel A is a time-sequence of gastric cross-sectional diameters at various locations along the longitudinal axis of the stomach (y axis). The relative diameter is colored according to the vertical scale to the right of panel A. At each timepoint, gastric diameter is expressed relative to the maximum diameter at that location; maximum diameter is shown in dark red and minimum in dark blue. Three narrow contractions, which are shaded in blue, propagated from the body to the pylorus (i.e., from 72 to 11 mm along the centerline). The horizontal line at 48 mm separates a proximal propagating contraction from a more slowly propagating distal contraction (see panel C). The spectral analysis (Panel B) reveals a dominant frequency of 2.4 cpm. The phase shift plot (Panel C) shows 2 linear contractions i.e., from 11 to 49 and from 49 to 72 mm with differing propagation velocities. Panel D shows the relative diameter change at 59 mm along the line; the contractions, which are identified by black arrows, are not only extremely powerful and completely occlude the lumen, but also relatively prolonged, lasting 10 seconds or longer. Panels E–H show gastric contractions (“contractograms”) derived from gastric MRI images (multiphase 2D FISP sequence) in a healthy subject. In contrast to Panels A–D, the contractions are weaker.
