
Figure 2.
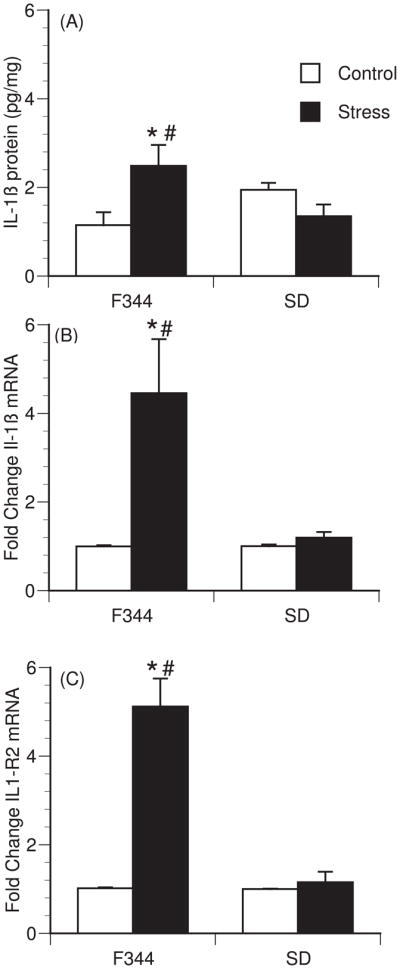
Strain differences in restraint stress-induced hypothalamic cytokines. (A) IL1β protein levels after 2 hours of restraint stress in Fischer 344 (F344) (n=9 per group) and Sprague-Dawley (SD) rats (n=8 per group). (B–C) Fold change from non-stress control in IL1β (B) mRNA, and IL1-R2 (C) mRNA expression immediately after 1h of restraint stress in F344 (n=6 per group) and SD rats (n=5 per group). Bars represent group means +/− SEM (* represents p<0.05 compared to strain control; # represents p<0.05 compared to SD stressed group).