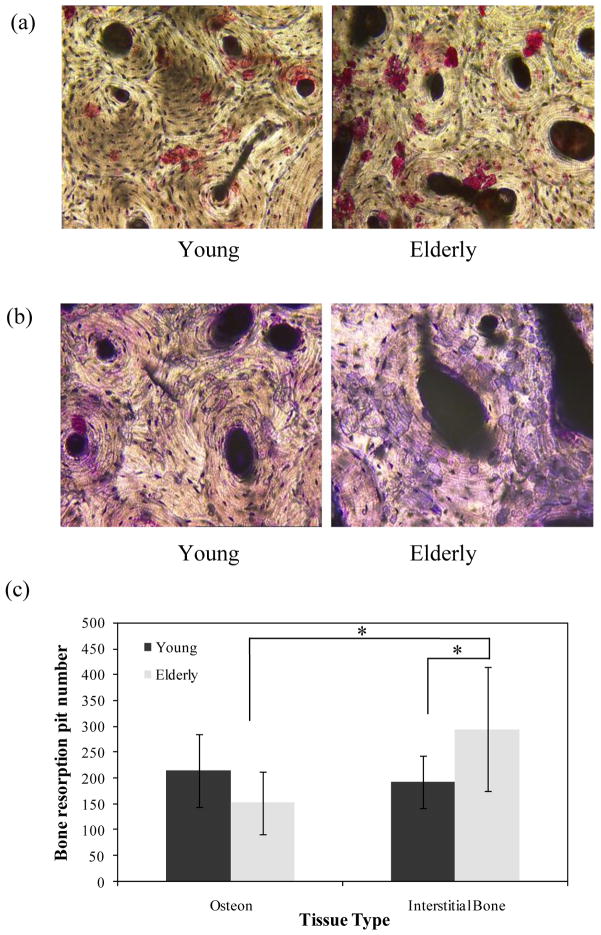
Figure 6.
(a) Representative images of TRACP positive osteoclast cells (100×); (b) Representative images of bone resorption pits (Toluidine blue staining) taken with transmitted light microscope (100×); (c) Comparison of average pit number of bone resorption at osteonal and interstitial regions for young and elderly groups.

