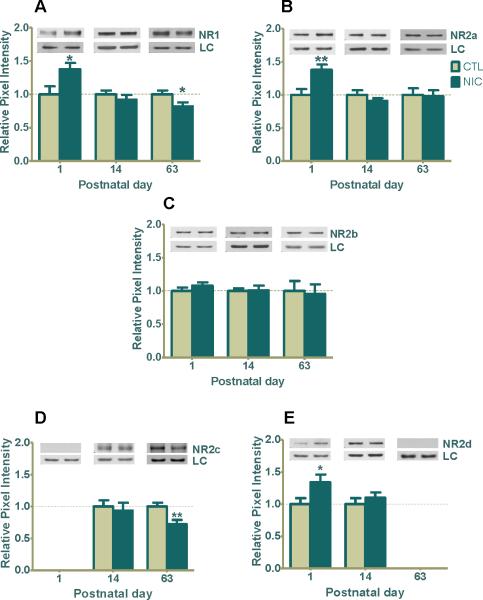
Figure 4. Prenatal nicotine exposure influences NMDAR subunits (NR1, NR2a, NR2b, NR2c, and NR2d) expression in developing rat hippocampus.
(A) Western blot analysis shows a significant nicotine-induced upregulation of NR1 at P1 (*p<0.05; n=6 CTL, 8 NIC), and no significant change at P14 (n=6 CTL, 8 NIC). However, at P63 the level of NR1 was significantly downregulated (*p<0.05; n=8 CTL, 9 NIC) whereas (B) NR2a expression was 38% increased from control (**p<0.01; n=7 CTL, 11 NIC) with no change seen at P14 (n=6 CTL, 6 NIC) or P63 (n=8 CTL, 9 NIC). (C) NR2b expression shows no significant regulation at any age in the presence of nicotine (n=6-8, CTL, 6-12 NIC) (D) NR2c expression was not detected at P1 (n=6 CTL, 9 NIC). Although NR2c shows no significant regulation at P14 (n=8 CTL 7 NIC), it was downregulated by 27% at P63 (**P<0.01; n=8 CTL, 9 NIC). (E) NR2d was upregulated at P1 (*P<0.05; n=6 CTL, 9 NIC) and was not changed at P14 (n=13 CTL, 13 NIC). It was not detected at P63 (n=5, CTL, 6 NIC). Values are the mean ± SEM relative to saline-treated controls. Typical western blots for each treatment and age group are shown in band pairs above the bars (left band: control; right band: nicotine). Abbreviation LC=loading control (GAPDH for P1 or β-actin for P14 & P63), CTL=control, NIC=nicotine-treated, n= the number of pups used for each bar.

