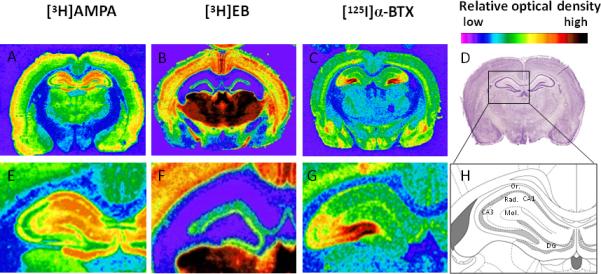
Figure 6. Representative autoradiographic images of [3H]AMPA, [3H]EB, [125I]α-BTX binding to the dorsal hippocampus of a normal adult rat brain.

Receptor autoradiography of [3H]AMPA binding to determine the distribution of AMPAR (A, E), [3H]EB to label all high affinity nAChRs (B, F), and [125I]α-BTX to label low affinity α7 nAChRs (C,G). Nissl stained sections are shown at the same level of the hippocampus for comparison (D), as is a schematic line drawing (H) to distinguish the anatomical landmarks according to The Rat Brian in Stereotaxic Coordinates by George Paxinos and Charles Watson, 5th Ed, 2005. E, F, G, H are high magnification images of hippocampus regions from A, B, C, D. Color changes from light blue, purple, green, yellow, orange, red, to black represent low to high binding density.
