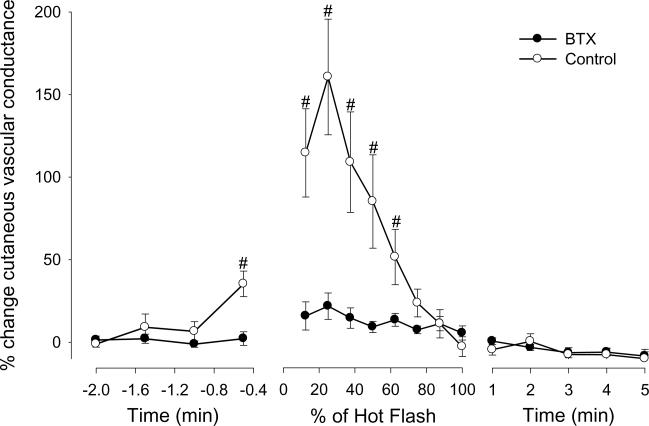
Figure 3.
Changes in glabellar cutaneous vascular conductance (CVC) at control and botulinum toxin type A (BTX) treated sites during hot flashes from protocol 2. #signifies significant difference between control and BTX-treated areas (P < 0.05). Data are expressed as a percentage change from pre-hot flash baseline.

