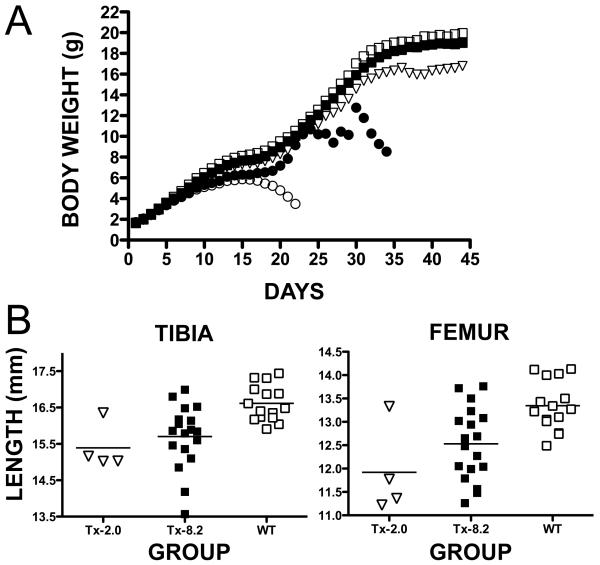
Fig. 2.
Changes in body weight with age and tibiae/femora lengths as a function of treatment dose. Panel A shows average daily body weights of Akp2−/− mice, from Day 1 to the end of the study, treated with Vehicle (◯), Tx-0.5 (●), Tx-2.0 (▽), Tx-8.2 (■) or untreated WT mice (□). Panel B shows individual lengths of the left tibiae and femora at the end of the study for the Tx-2.0 (▽) and Tx-8.2 (■) treatment groups compared to WT mice (□).

