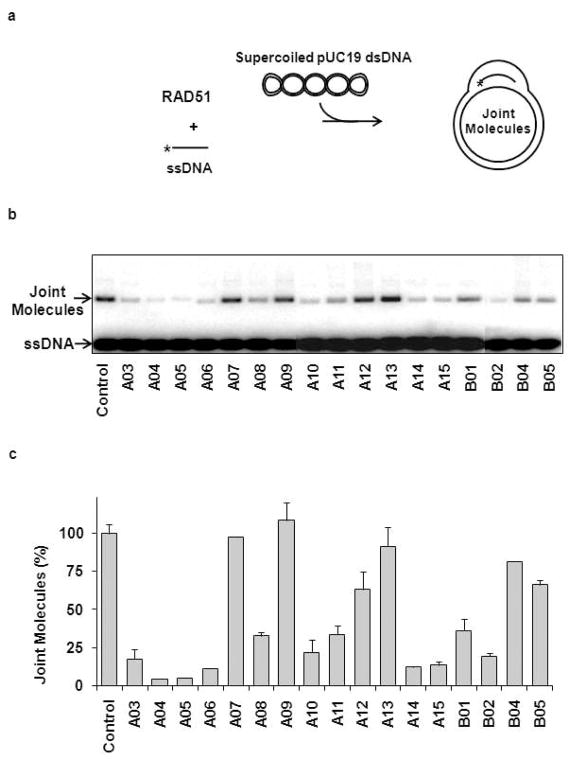
Figure 3. Secondary screening of the RAD51 inhibitors using the D-loop assay.
(A) The scheme of D-loop formation promoted by RAD51. The asterisk denotes the 32P label. (B) Analysis of 17 compounds selected by HTS. RAD51 (1 μM) was incubated with a 90-mer ssDNA (3 μM) (Oligo 90) to form the filament followed by addition of indicated compounds (100 μM). Joint molecule (D-loop) formation was initiated by addition of pUC19 supercoiled dsDNA (50 μM). The DNA products were analyzed by electrophoresis in a 1% agarose gel. The control was carried out under identical conditions except that no tested compounds were added. (C) The effect of selected compounds on the yield of joint molecules was plotted as a graph. The extent of D-loop formation in the absence of inhibitors, 40.3%, was expressed as 100% of D-loop formation efficiency. Experiments were repeated at least three times; error bars represent S.D. (standard deviation).

