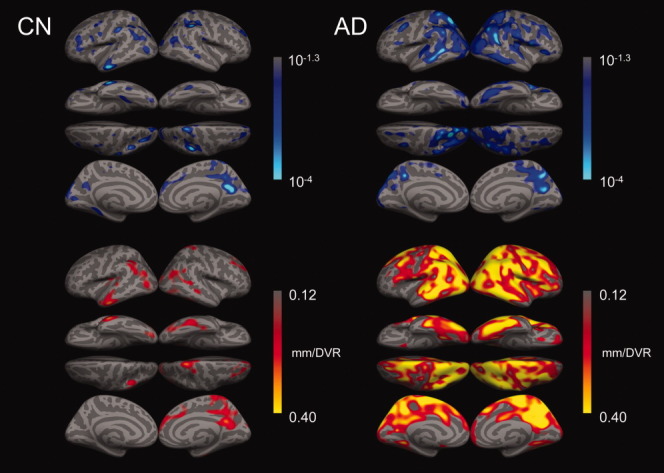
FIGURE 1.

Aβ-associated reduction in cortical thickness in CN subjects and AD patients. Regression coefficients expressing reduction in thickness at each vertex per unit increase in PCC DVR controlling for age (bottom row), and corresponding statistical significance as p value (top row) in CN or AD groups (left or right column, respectively). Only clusters of 3000 or more contiguous vertices with regression coefficients exceeding 0.12mm/DVR are shown on the bottom row of surfaces.
