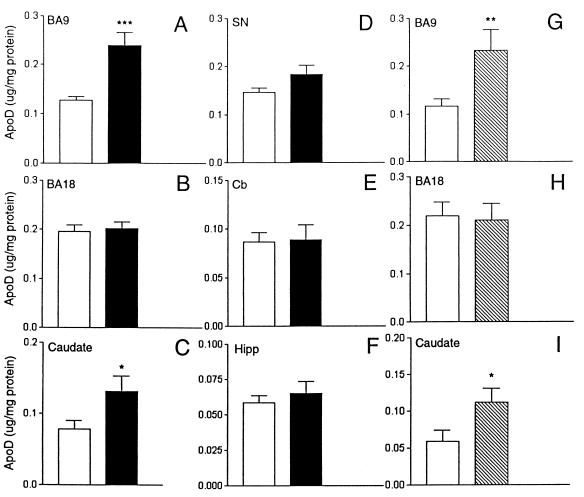
Figure 4.
ApoD levels in dorsolateral prefrontal cortex (BA9; A and G), occipital cortex (BA18; B and H), caudate (C and I), substantia nigra (SN; D), cerebellum (Cb; E), and hippocampus (Hipp; F) of control (open bars), schizophrenic (solid bars), and bipolar (stippled bars) subjects. ApoD concentrations were measured by ELISA using purified apoD as a standard. Significant differences are indicated by asterisks as determined by student's t test (two-tailed). ***, P = 0.0002; **, P = 0.02; *, P = 0.04.

